
Top AI Repos
Open-source AI, indexed and scored.
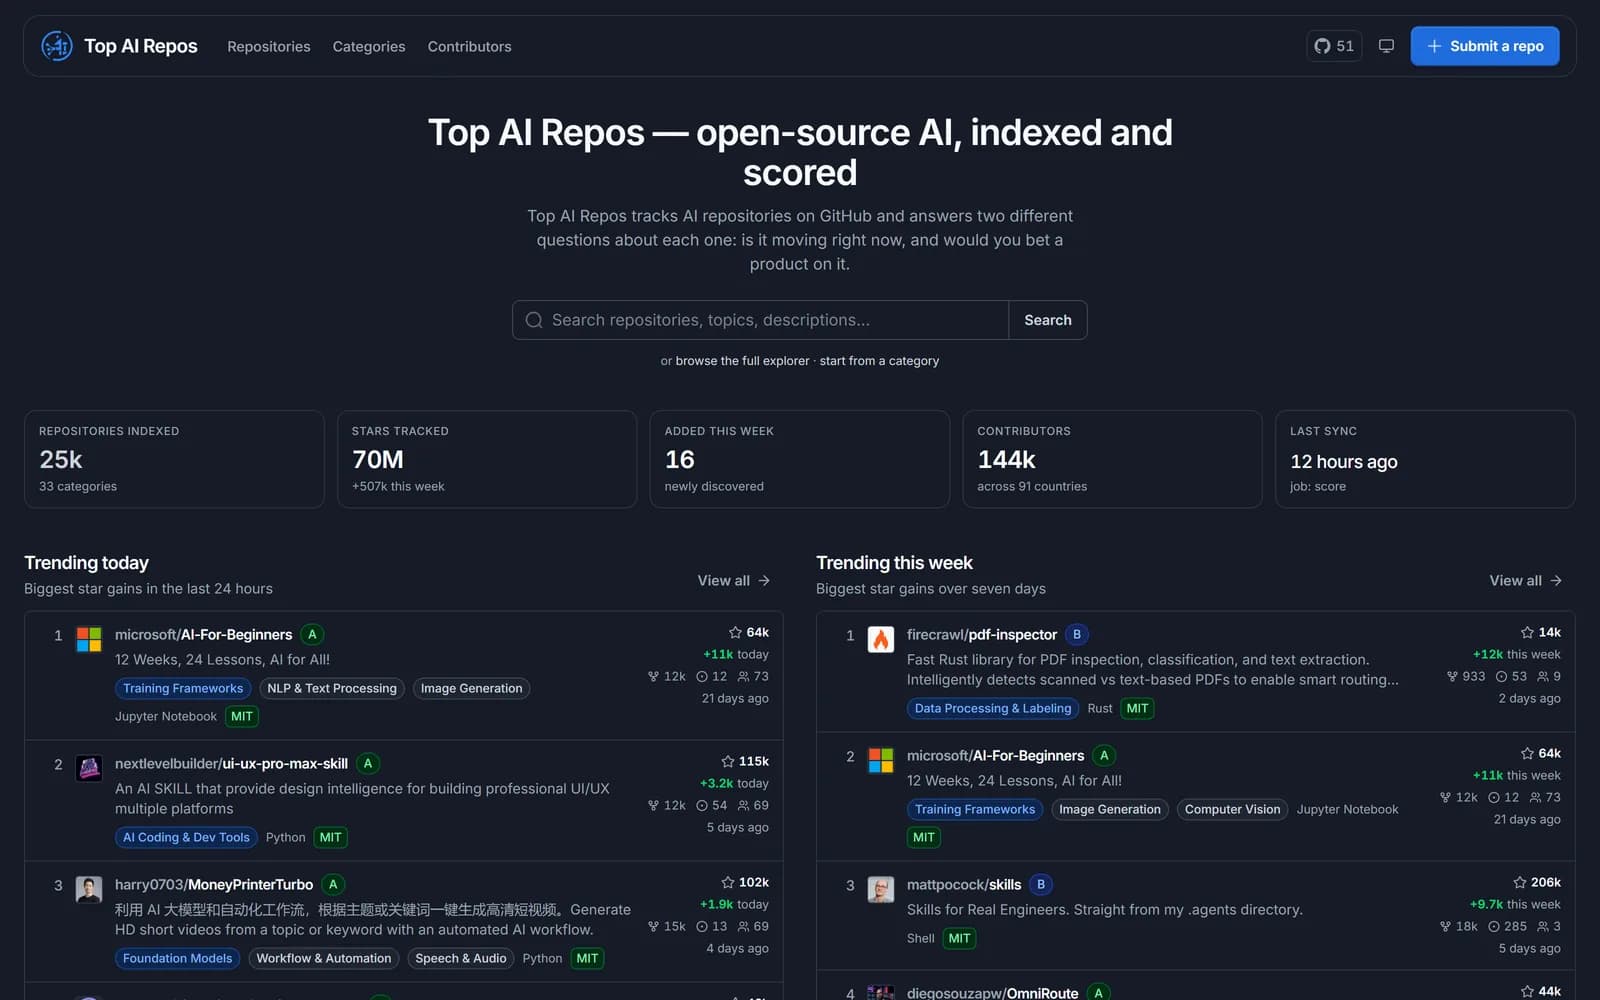
An open-source platform that tracks 25,000+ AI repositories on GitHub and answers two different questions about each one: is it moving right now, and would you bet a product on it?
- Role
- Creator & Maintainer
- Type
- Open-Source Platform
- Stack
- Next.js · TypeScript · PostgreSQL · Drizzle
- Scope
- Data Pipeline · Scoring · Search
- Licence
- Apache 2.0
- Live
- topairepos.com
01 - The Problem
A star count is a lifetime total, not a signal.
Picking an AI library off GitHub usually means sorting by stars. But a star count is cumulative and never goes down - it tells you a project was popular at some point, not whether it is alive today. A repository with 40k stars and no commit in eight months outranks one with 3k stars shipping weekly releases.
The AI ecosystem makes this worse. It moves fast enough that a framework can go from essential to abandoned inside a release cycle, and the sheer volume means nobody can manually track what is happening across the whole field.
Two genuinely different questions get collapsed into one number: is this moving right now, and would I bet a product on it? A weekend project trending on Hacker News scores well on the first and badly on the second. A mature, boring, well-maintained library is the reverse. One metric cannot answer both.
02 - Two Scores, Not One
Momentum and durability are measured separately.
Every repository carries two independent scores. The trend score reads current momentum - daily and weekly star deltas, contributor growth, release recency - penalised for inactivity. It is unbounded and purely comparative: useful for ranking, meaningless in isolation.
The quality scoreis the opposite by design: bounded 0-100, graded A through D, and deliberately slow to move. It is the "would you bet a product on this" number, and it is built from six signals rather than one:
- Maintenance - how recently the default branch was actually pushed to
- Releases - recency and cadence of tagged releases, not just commits
- Community - contributor breadth and bus factor
- Issue backlog - open issues measured against the size of the audience
- Documentation - README depth, plus a homepage and topics
- Licensing - how freely the code can actually be adopted
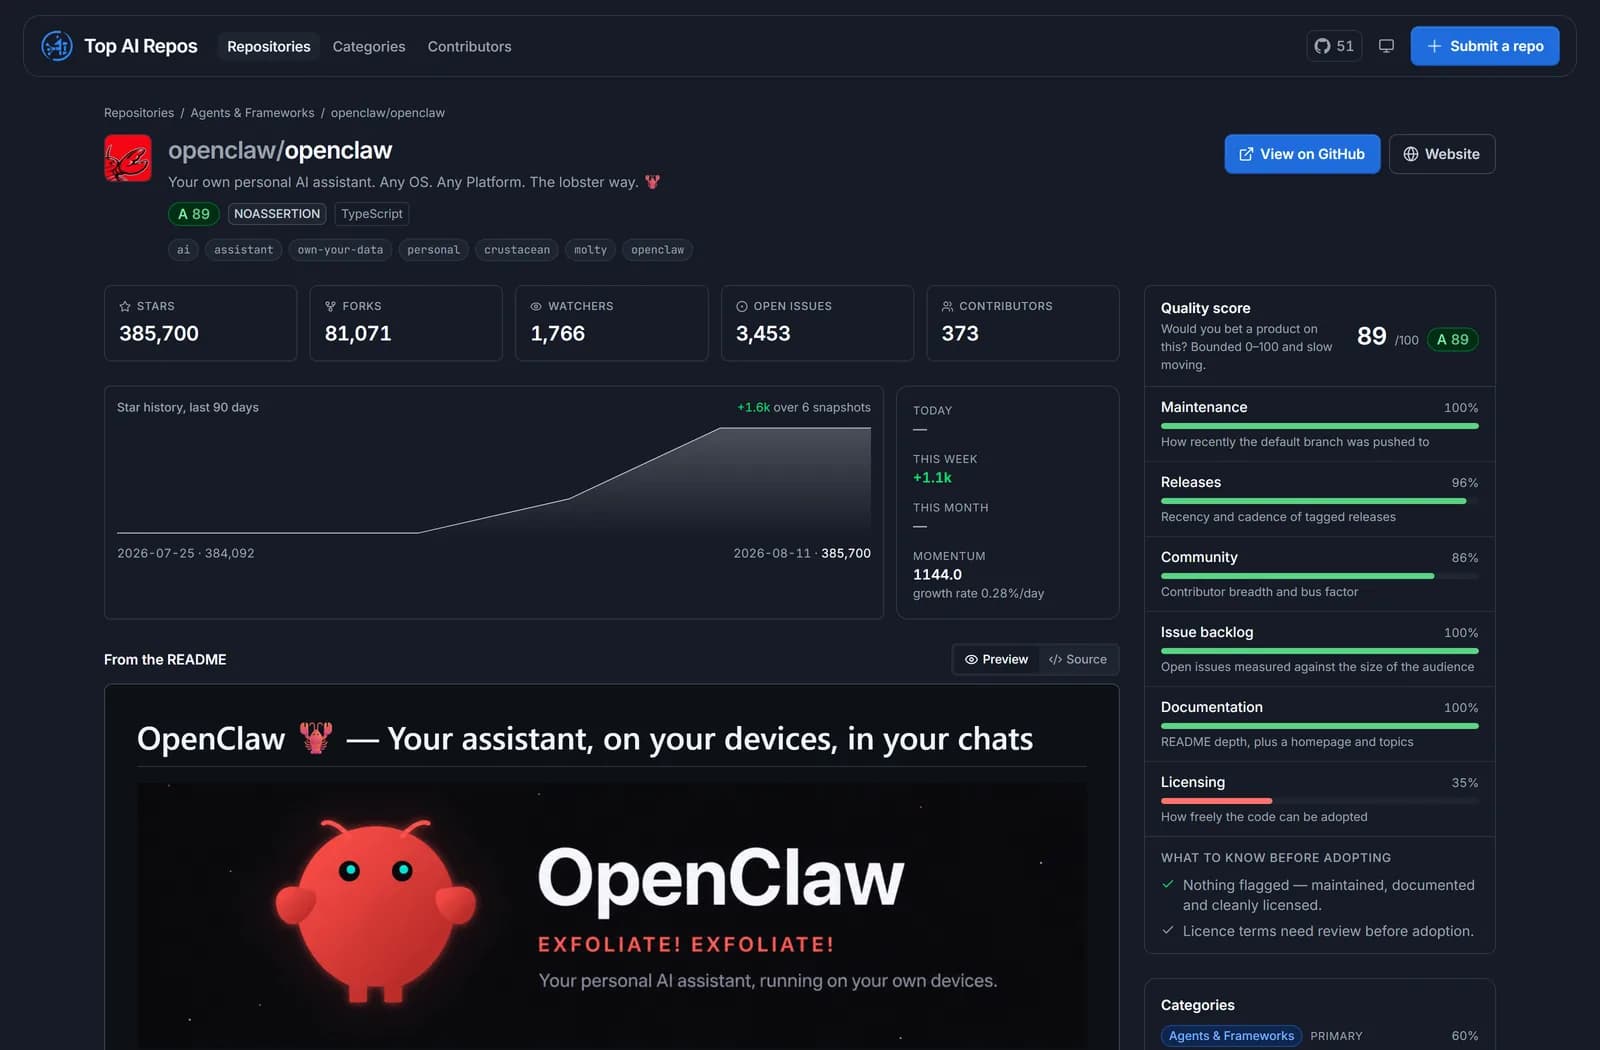
Showing the breakdown matters more than the score itself. A repository graded A 89 with licensing at 35% is telling you something specific and actionable: it is well built, but check the licence before you adopt it. A single composite number would have hidden that entirely.
03 - The Pipeline
Eight stages, and the order is load-bearing.
The daily job runs as eight sequential stages: discover, sync, snapshot, countries, contributors, profiles, classify, score. Discovery works from 317 curated GitHub topics plus 61 free-text phrases, which is how the index reaches roughly 30,000 repositories without hand-curation.
Snapshot sits third for a reason that only becomes obvious once it is wrong. Today's metrics row still carries yesterday's contributor counts - so the snapshot has to be written before the contributor stage overwrites them. Run those two in the other order and the historical series is silently corrupted, with no way to recover it later. Time-series data is unforgiving that way: you cannot backfill a measurement you failed to take.
Storage is change-only. Writing a row per repository per day would mean 29,000 rows every run; writing only when a value actually changes brings that down to about 1,800. Same fidelity, a fraction of the growth - which is what keeps the whole thing runnable on a single modest Postgres instance.
04 - Making 25,000 Repos Navigable
An index nobody can browse is just a database.
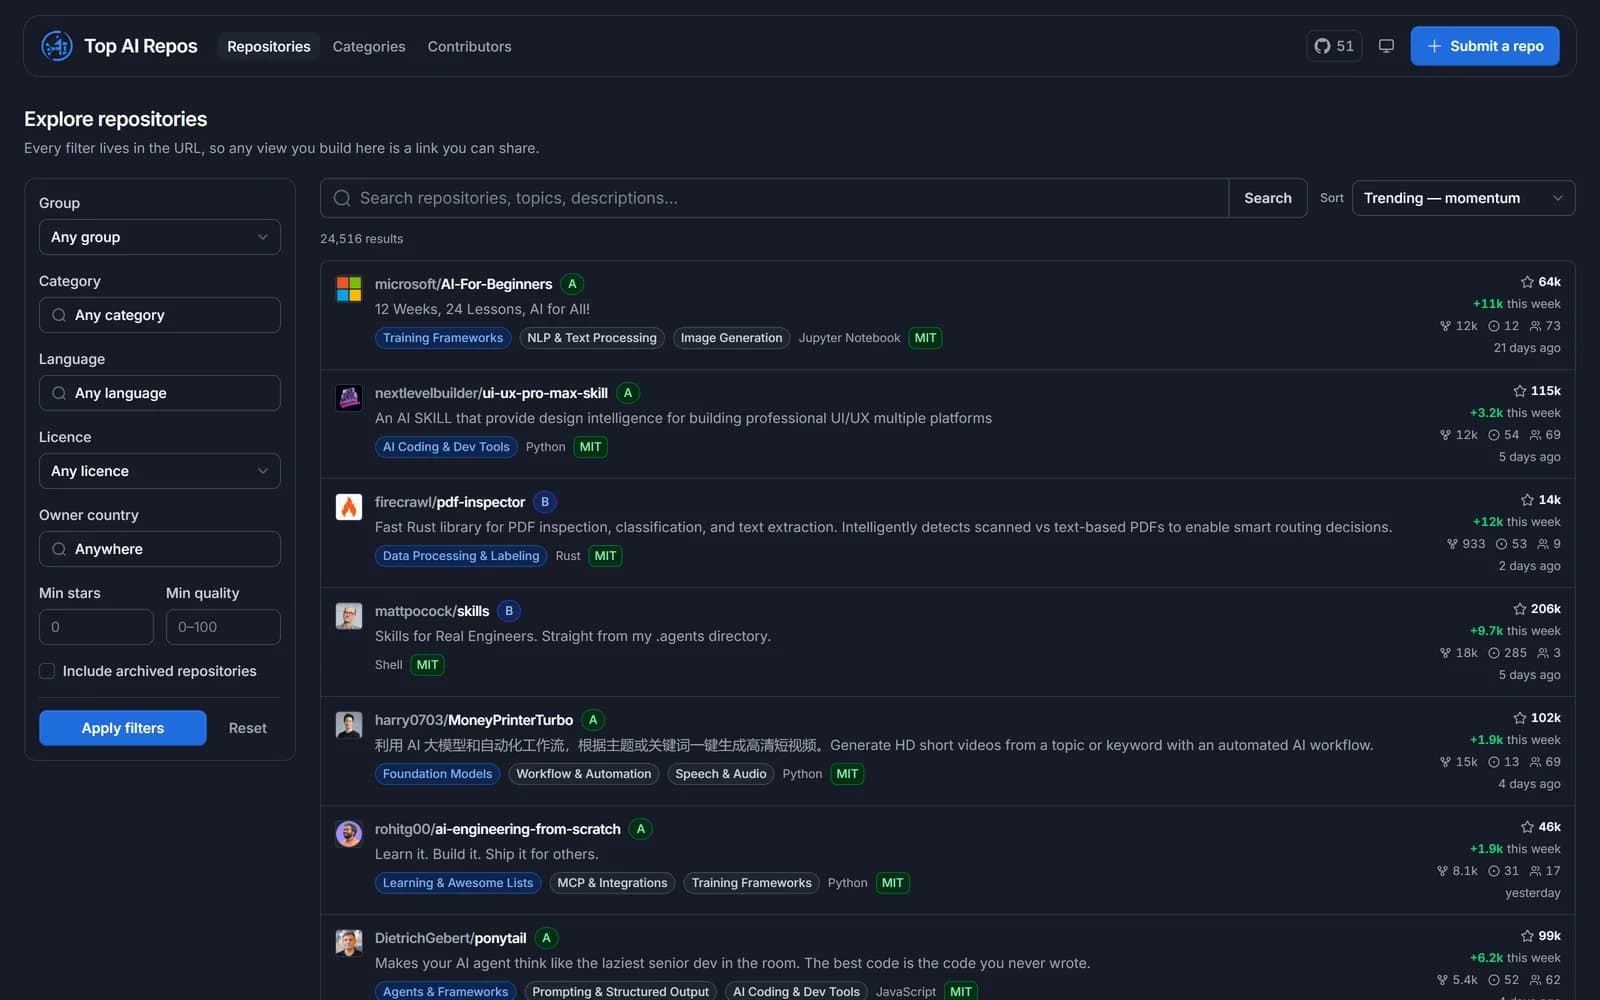
Scale creates its own problem: 25,000 repositories is far past what anyone will scroll. Everything is classified into three broad groups - Infrastructure, Model Development, Application Development - and then into 33 categories beneath them, from Vector Databases & Search to Agents & Frameworks to GPU & Distributed Compute.
Each repository gets exactly one primary category, which is what makes the counts add up instead of double-counting across a tag cloud. Classification runs from repository metadata and a truncated README, with an LLM only as a fallback for the cases heuristics cannot place.
05 - Every View Is a Link
Filter state lives in the URL, not in memory.
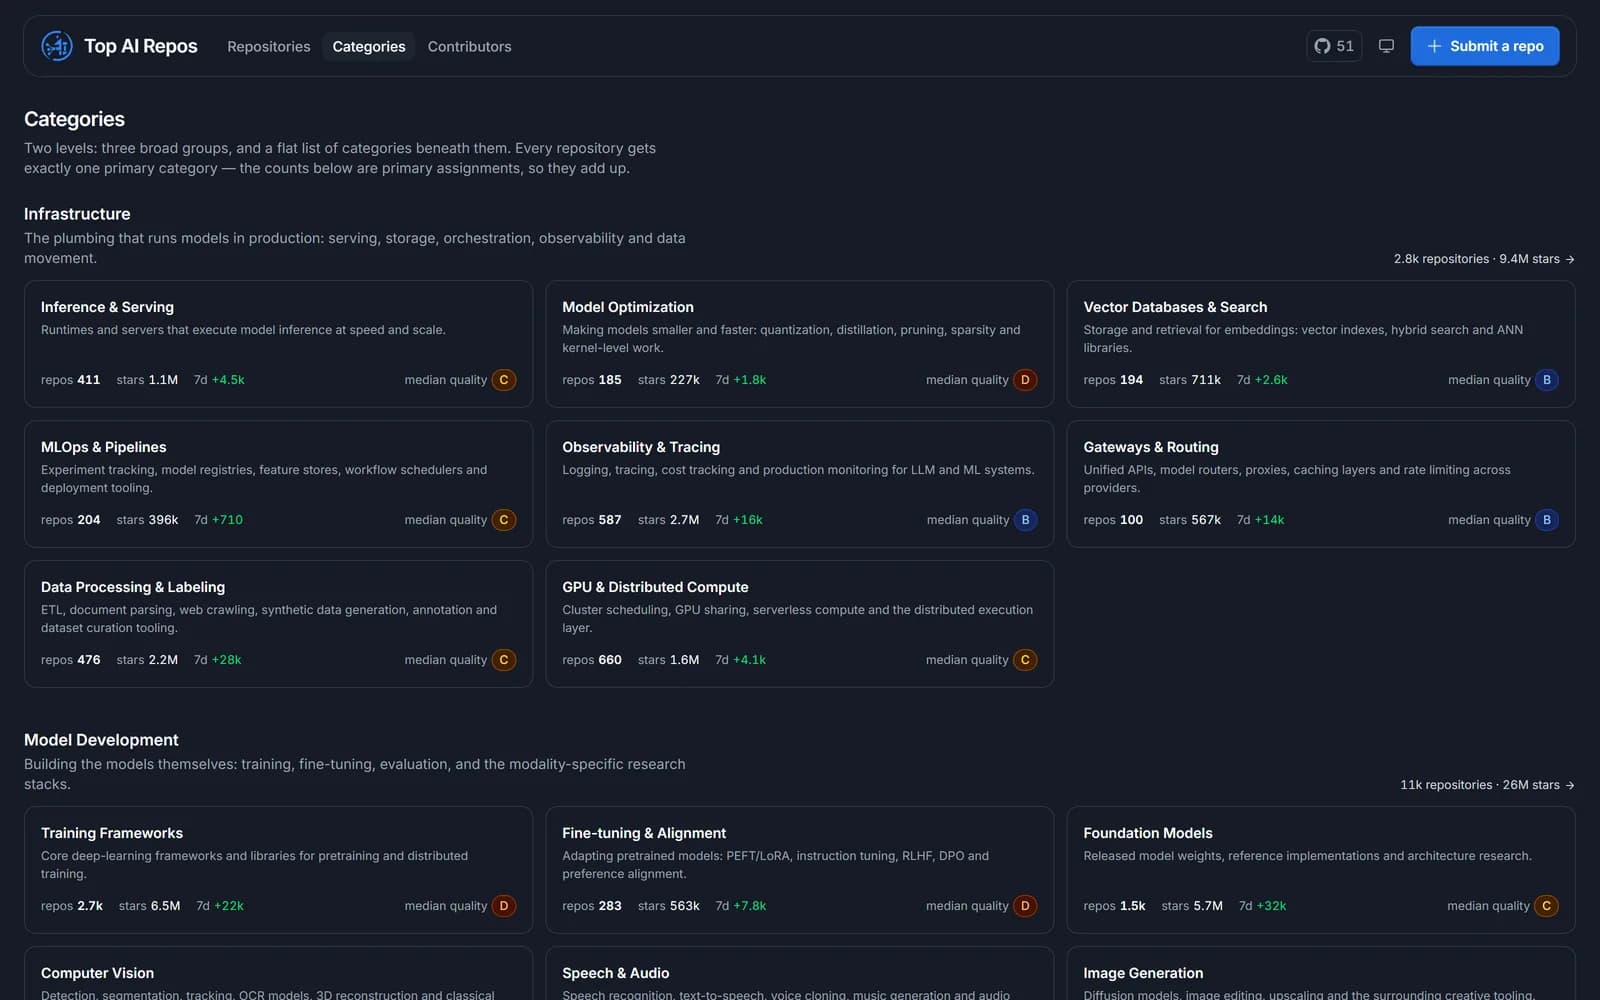
The explorer filters by group, category, language, licence, owner country, minimum stars and minimum quality. All of it is serialised into the URL, so any view you build is a link you can send to someone - "Rust vector databases above quality 70" is a shareable address, not a sequence of clicks you have to describe.
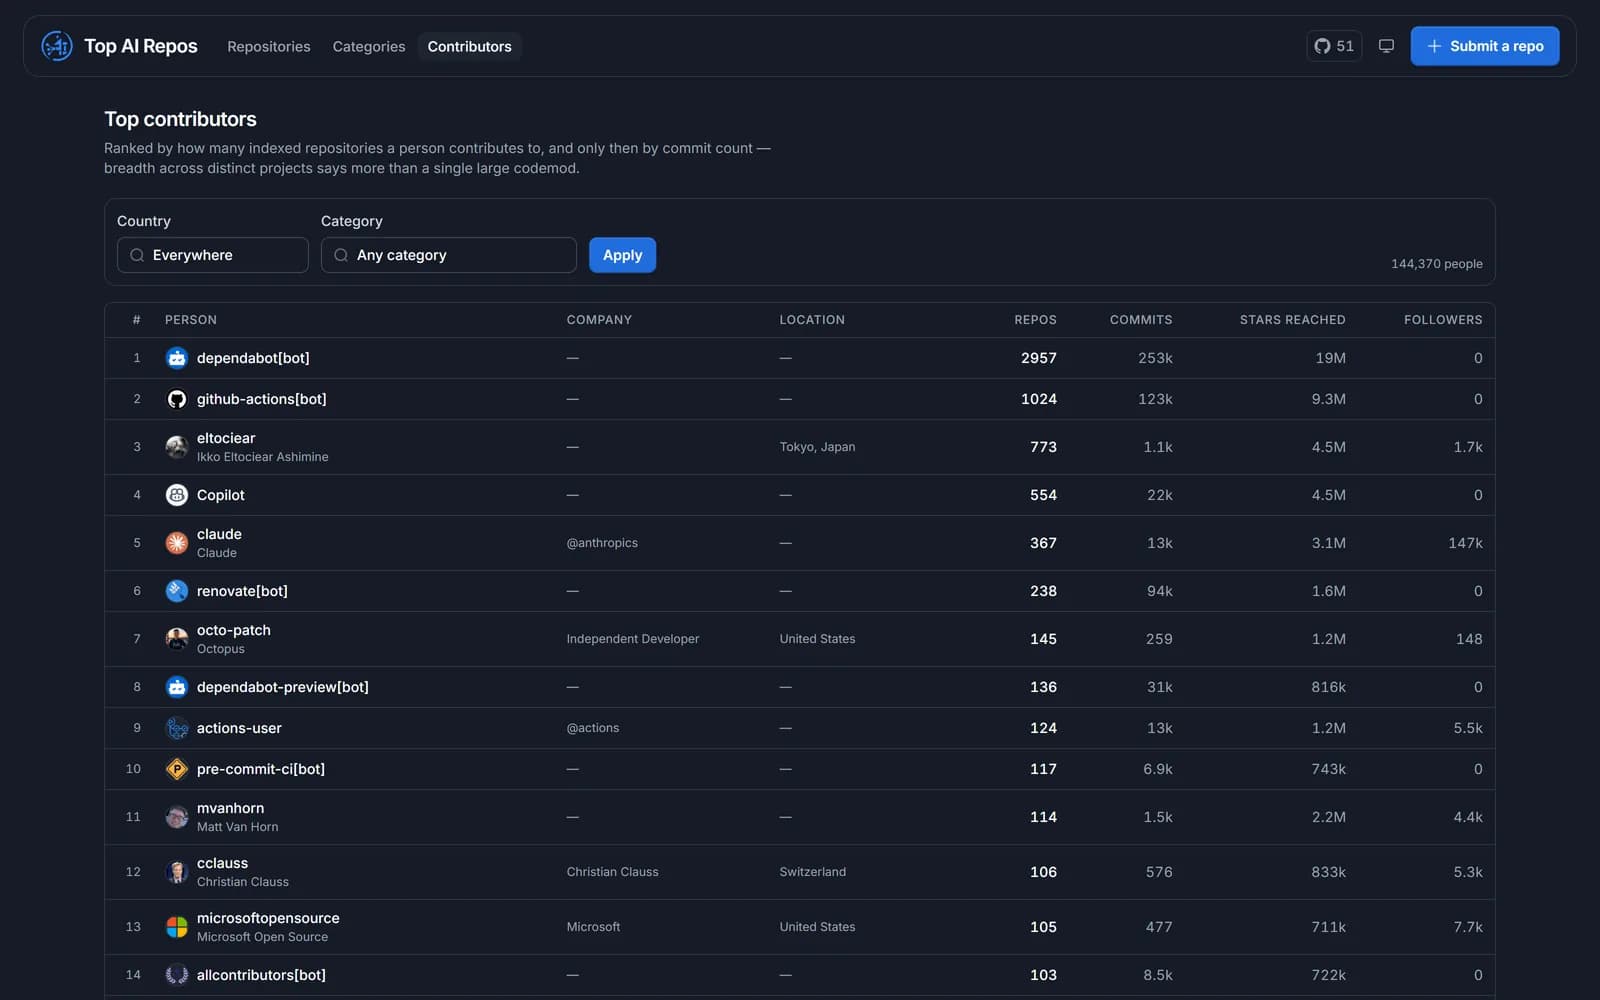
The same data supports a people view. Contributors are ranked by how many distinct indexed repositories they contribute to, and only then by commit count - breadth across projects says more about someone than a single large codemod does.
- The result -
Open source, all the way down.
Top AI Repos tracks 25,000+ repositories and 70M stars, refreshed daily, with 144k contributors mapped across 91 countries. The whole thing is Apache 2.0 and runs on Postgres you can host yourself - Supabase, Neon, or your own box.
Building it was mostly a data-engineering problem wearing a web-app costume. The interesting work was not the UI: it was designing scores that stay honest as inputs drift, getting the pipeline ordering right so history stays intact, and keeping storage flat while the index grows. A tool that ranks open-source projects on how openly they are built should be inspectable itself - so the scoring code is right there in the repo.